
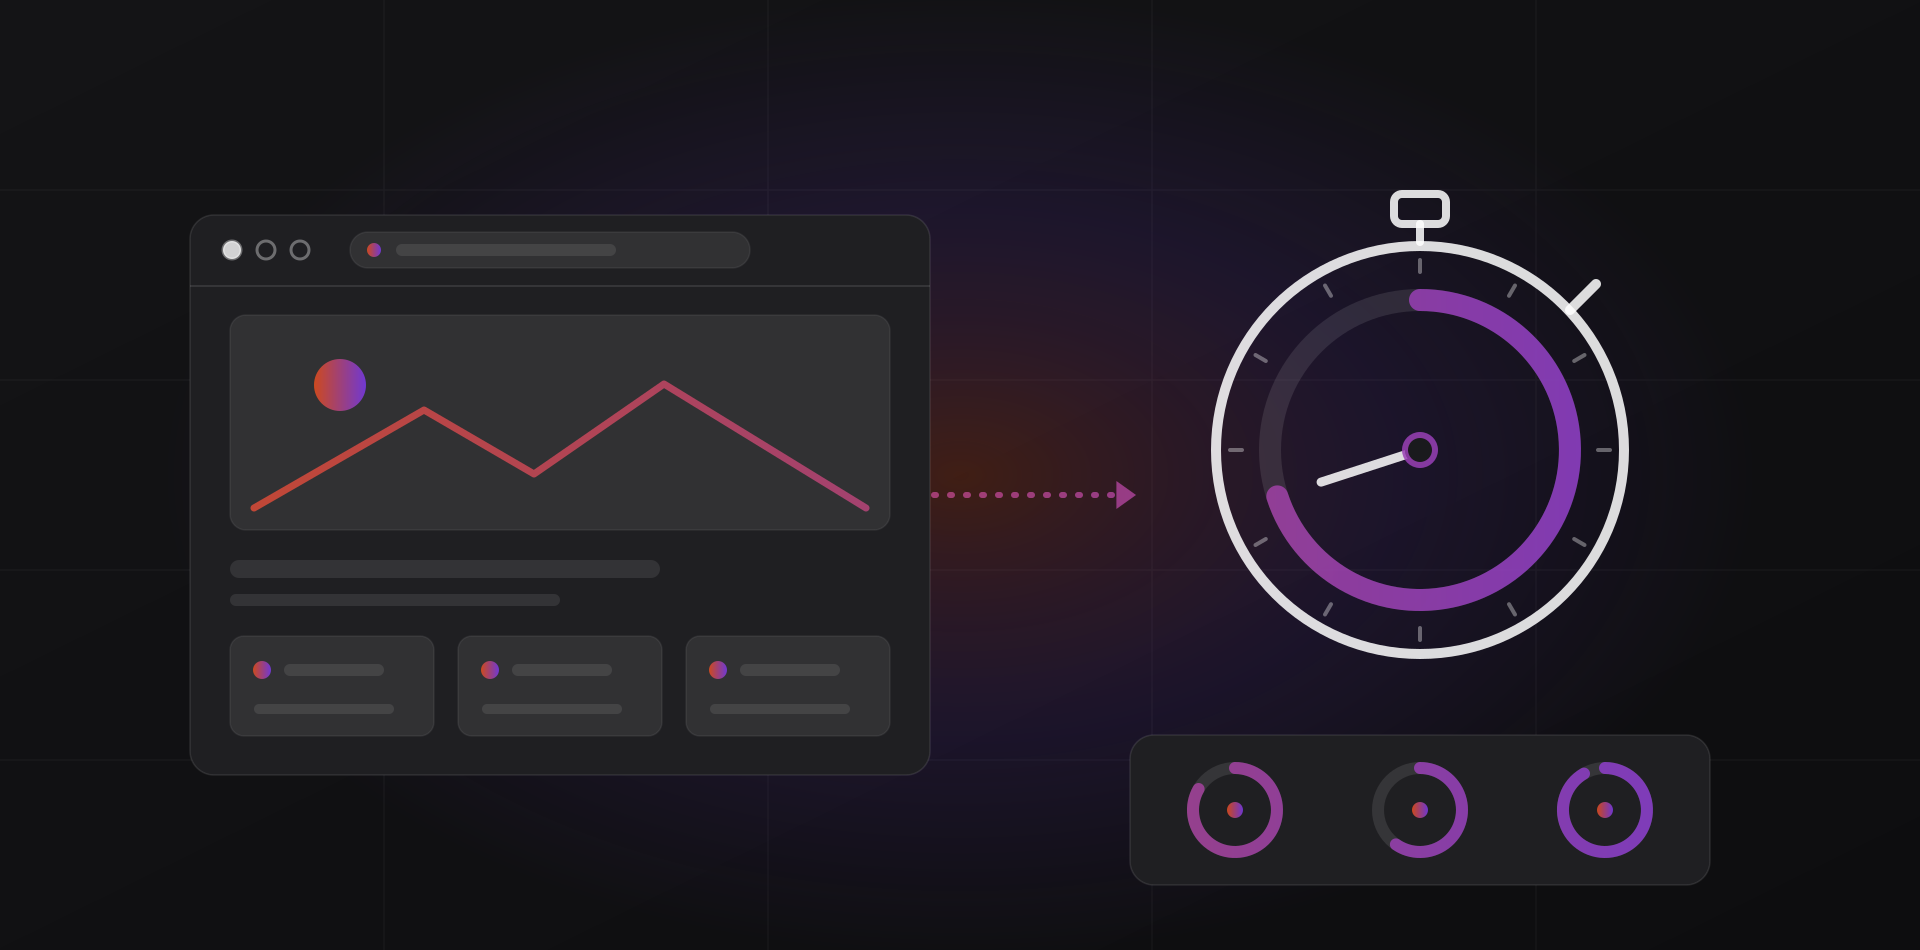
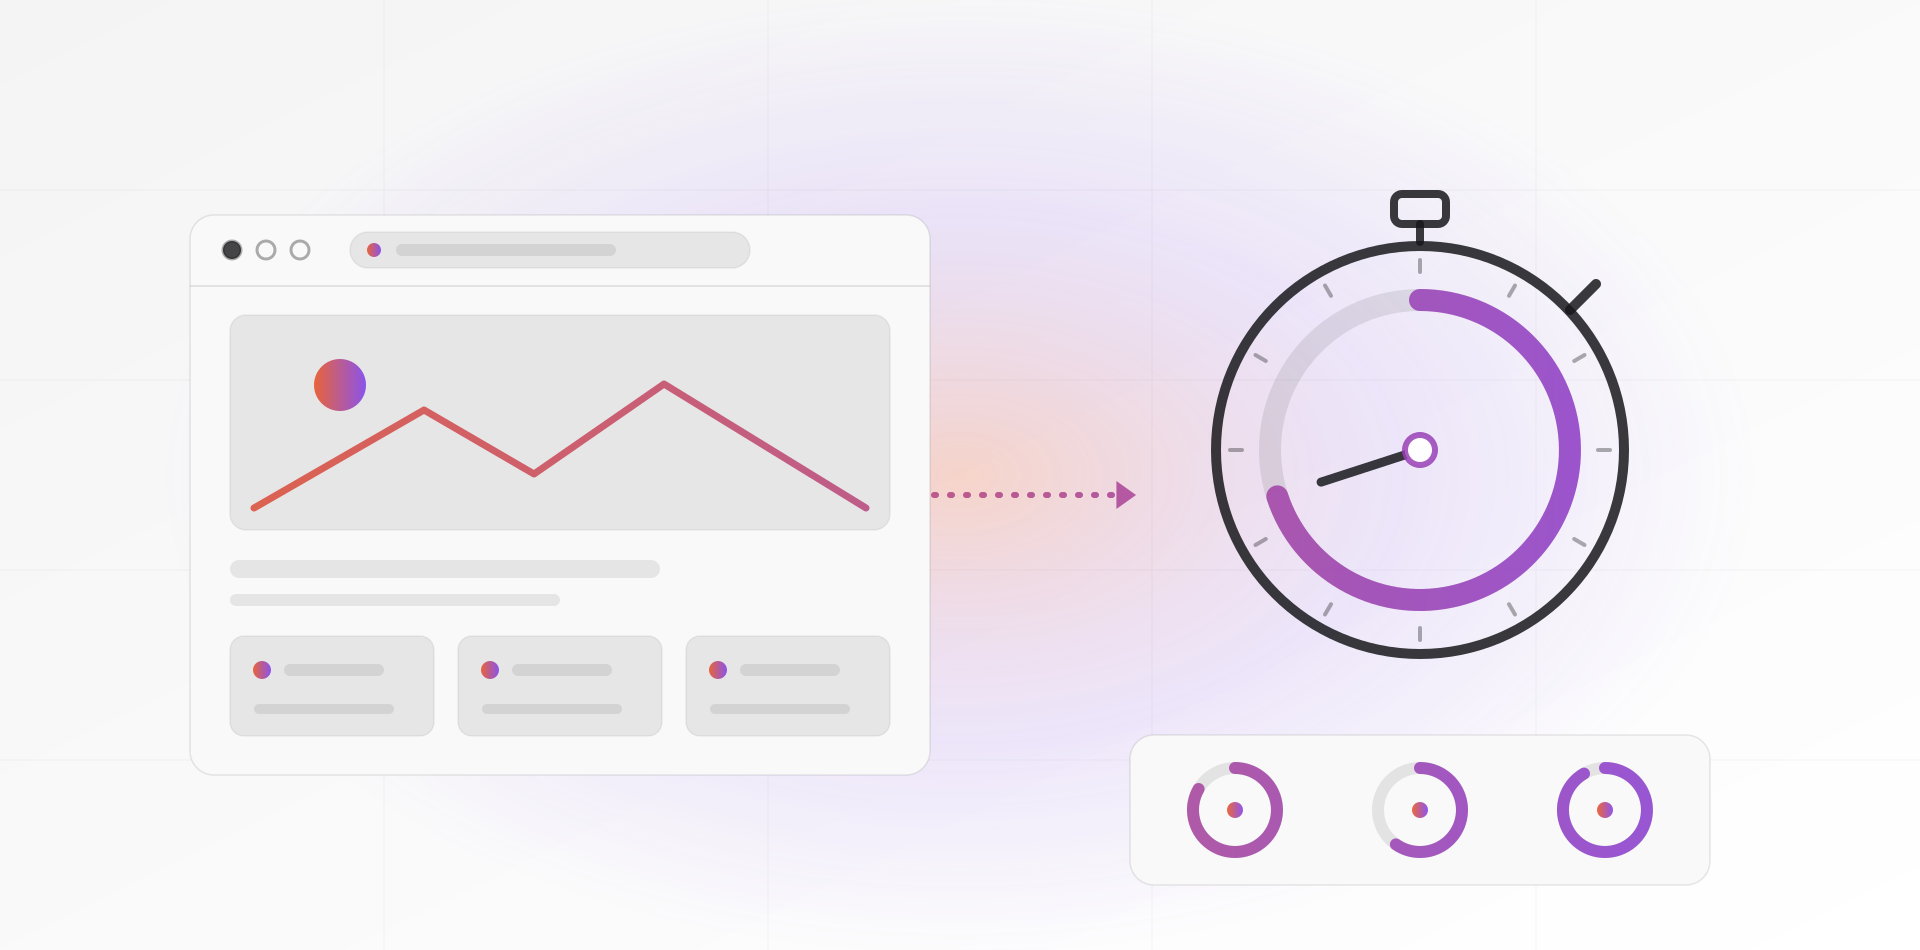
Core Web Vitals are three measurements Google uses to judge page speed: how fast the main content appears (LCP, 2.5 seconds or less), how quickly a tap gets a response (INP, 200 milliseconds or less) and how little the page jumps around (CLS, 0.1 or less). Most failures have dull, fixable causes.
This guide is for owners who have been told their website is slow. It explains what the numbers mean, how to check them and what to fix first. You do not need to read code. You do need to know which questions to ask whoever looks after your site.
Website speed matters for two reasons. Visitors leave pages that stall. And Google counts these measurements as one ranking signal among many. Relevant content still beats a fast page with nothing useful on it, so treat speed as hygiene: cheap to fix, easy to lose.
The three numbers, in plain language
Each metric measures something a visitor can feel.
LCP: how fast the main content appears
Largest Contentful Paint is the time until the biggest visible element is drawn. On most pages that is the hero image, a banner or the main headline block. Good is 2.5 seconds or less.
INP: how fast the page reacts
Interaction to Next Paint measures the delay between a tap, click or key press and the next thing the screen shows. It reports roughly the slowest interaction of the visit. Good is 200 milliseconds or less. INP replaced the older First Input Delay (FID) metric on March 12, 2024, so advice that still talks about FID is out of date.
CLS: how much the page jumps
Cumulative Layout Shift scores unexpected movement. You know it when you reach for a button and an ad pushes it down. Good is 0.1 or less. It has no unit; it is just a score.
A page passes when it is good on all three at the 75th percentile: three in four real visits must meet the threshold, with phones and desktops measured separately. Google's own definition is on web.dev.
Field data or lab data: which number do you believe?
Field data comes from real visitors. Chrome records timings from users who agreed to share them, and Google publishes the results as the Chrome User Experience Report. Lab data comes from a test: a tool loads your page once on a simulated phone and connection and reports what happened.
Believe the field data. It is what Search Console reports, and it reflects your actual visitors' phones and networks. Use lab data for diagnosis. It shows why a page is slow and lets you test a fix before visitors see it.
Lab tools have blind spots. Lighthouse, the engine behind lab results, cannot measure INP, because a test run has no real taps. It reports a stand-in called Total Blocking Time instead.
Where to look
- PageSpeed Insights (pagespeed.web.dev): paste a URL. The top block is field data for that page, or for your whole site if the page has too little traffic. The block below is the lab test.
- Search Console, Core Web Vitals report: field data for the whole site, with URLs grouped as good, needs improvement or poor. Check it monthly.
- No field data at all? Your traffic is too low for Google to report. Rely on the lab results and common sense.
- Allow for the delay. Field data covers a rolling 28 days, so a fix can take up to a month to show.
Where the time goes: the usual culprits
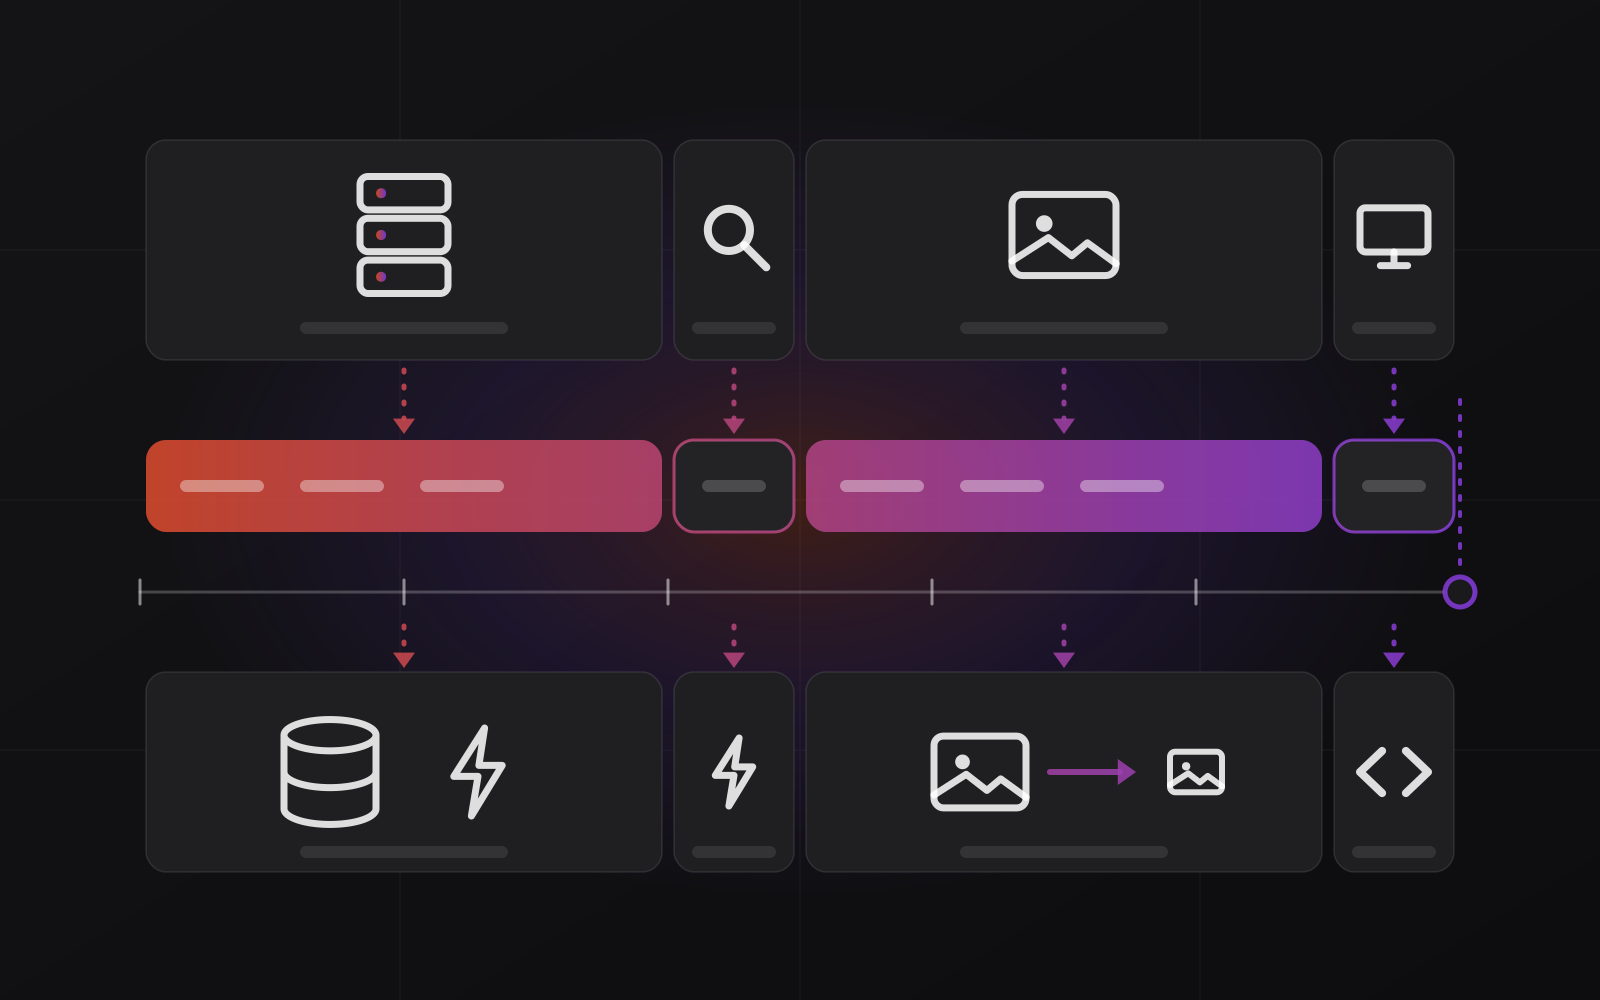
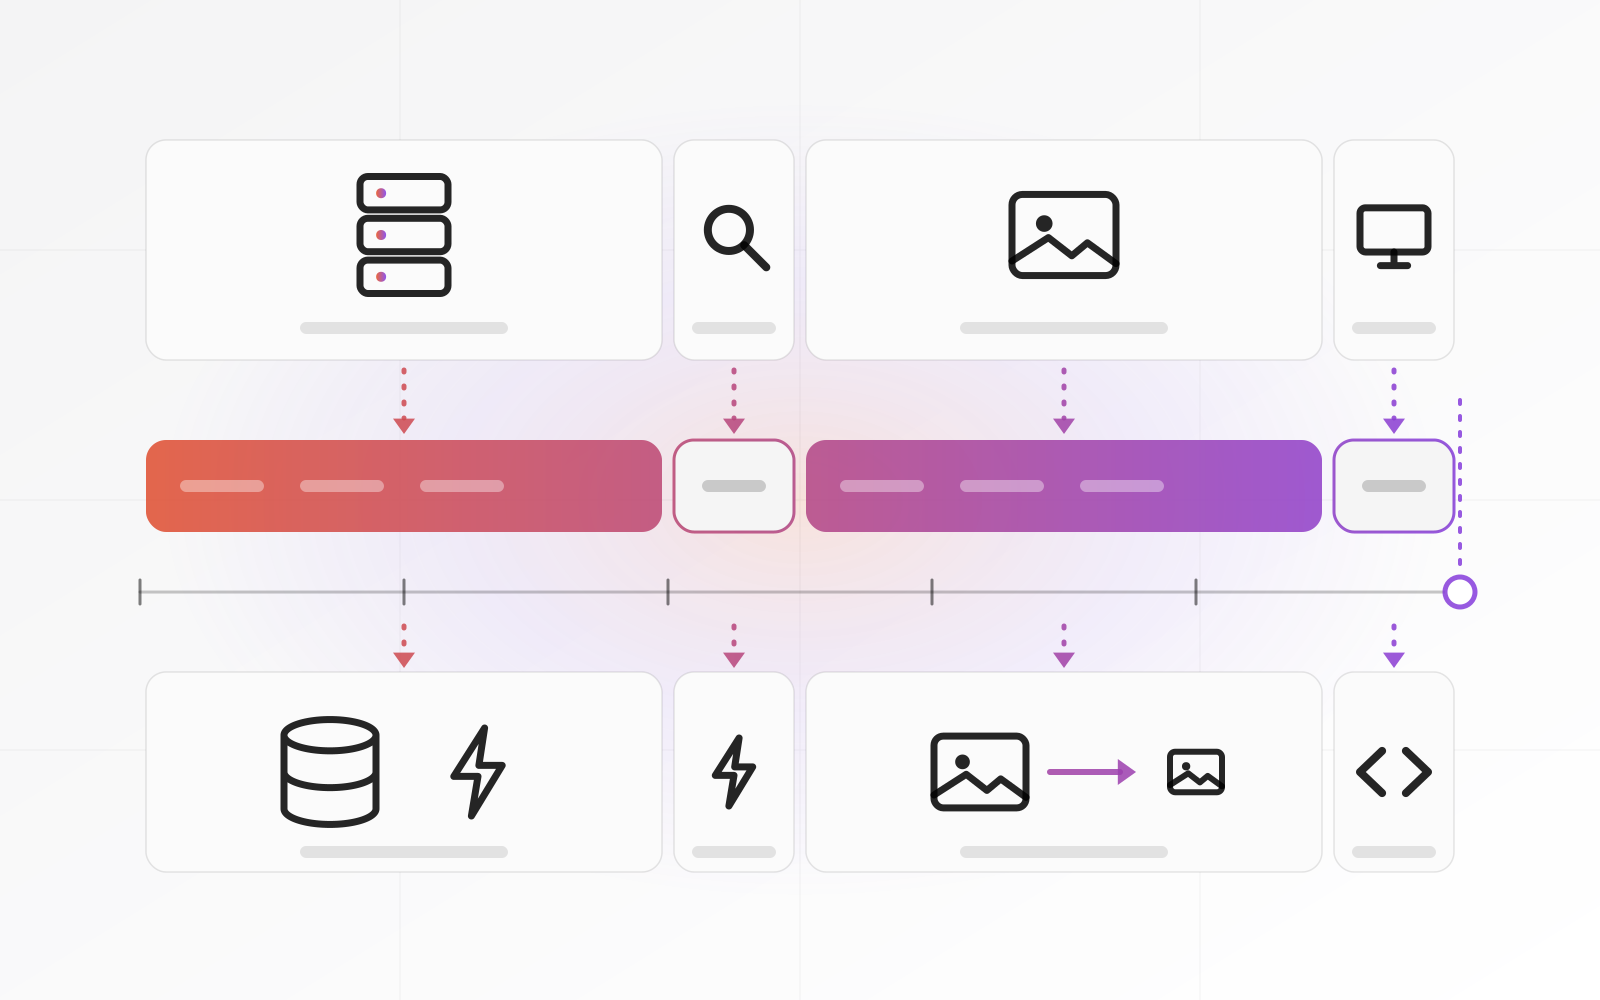
Open any slow site and you tend to find the same suspects. Google splits the LCP wait into four parts: the server answering, the browser finding the main image, downloading it and drawing it. On a healthy page, web.dev suggests about 40 percent goes on the server wait and about 40 percent on the download, with the other two parts as small as possible.
Huge images
This is the first place to look. A phone photo straight from the camera weighs several megabytes and is 4,000 pixels wide. Shown at 600 pixels, the browser still downloads all of it.
Resize to the largest size actually displayed. Save as WebP or AVIF. Let the browser pick a size with srcset. Never lazy-load the hero image, because that delays the very picture LCP is timing. Do lazy-load everything below the first screen.
Too many scripts and third-party widgets
Every chat bubble, review carousel, tracking pixel, heatmap and social feed is code that downloads and runs on your visitor's phone. Scripts from other companies are the hardest to control. They are also a common reason a page looks ready but feels sticky, which is what INP measures.
Open your tag manager and list what is in it. Remove anything nobody can name. Load the chat widget after the page finishes, or on first click.
Slow hosting
If the server takes two seconds to answer, your 2.5-second budget is gone before the first image starts. web.dev warns that a slow first byte can make a good LCP hard or even impossible. Typical causes are crowded shared plans, no page caching and builders that assemble every page from scratch on each visit.
The fix is caching, a content delivery network and a plan sized for your traffic. Our guide to choosing web hosting covers the options.
Web fonts
Each weight of each font family is a separate download. Keep two families and two weights at most. Use the WOFF2 format, set font-display to swap so text shows at once in a fallback font, and preload the one used in your headline. Pick a fallback of similar width so the text does not shift when the real font arrives.
Content that moves
CLS comes from boxes that grow after they appear: images without width and height, cookie banners pushed in above the content, embeds and ads that load late. Give every image dimensions. Reserve space for embeds. Show banners as overlays rather than pushing the page down.
Fixes in order of payoff
Work from the top and measure after each step. The first fix often changes what the second one needs to be.
- Resize and compress the hero image and everything above the fold. Add fetchpriority="high" to the hero image tag.
- Delete scripts and plugins nobody uses. Delay the rest until after the page loads.
- Turn on page caching and a content delivery network. Check the server response time in PageSpeed Insights.
- Cut fonts to two families and two weights, in WOFF2, with font-display set to swap.
- Add width and height to images, and reserve space for embeds and banners.
- If INP is still above 200 milliseconds, ask a developer to break up long JavaScript tasks.
The first three mainly move LCP, and removing scripts helps INP too. The last three steady CLS and INP, and the last one is more often a developer's job than a plugin's.
Fix the biggest image first, measure again, and only then touch anything clever.
When not to chase the score
Do not chase a perfect 100 in a lab test. That score is not the Core Web Vitals verdict, and a number earned on a fast laptop proves little. If Search Console already shows your URLs as good, stop and spend the time on content. And do not install five speed plugins: they add code and fight each other.
Keeping a site fast after you fix it
Speed erodes. Someone adds a video background, a new tracking pixel, a 6 MB banner. Four habits stop that.
- Check the Search Console report monthly. It reacts slowly, but it shows what real visitors feel.
- Write one rule down: no new script or plugin goes live until someone has measured its effect.
- Test on a mid-range phone, not only on the office laptop and fibre line.
- Re-run PageSpeed Insights after every redesign and every major plugin update.
Planning a redesign? Put the three thresholds in the brief and check them before launch. Our guide to redesigning without losing rankings covers what else to protect.
Frequently asked questions about Core Web Vitals
What are the Core Web Vitals?
They are three metrics Google uses to describe real-world page experience: Largest Contentful Paint for loading, Interaction to Next Paint for responsiveness and Cumulative Layout Shift for visual stability. Each has a threshold for good, and a page passes when 75 percent of visits meet all three.
What is a good Core Web Vitals score?
There is no single score. Good means an LCP of 2.5 seconds or less, an INP of 200 milliseconds or less and a CLS of 0.1 or less, measured at the 75th percentile of real visits. The 0 to 100 Lighthouse score is a separate lab number and not the same thing.
Did INP replace FID?
Yes. Interaction to Next Paint replaced First Input Delay as one of the Core Web Vitals on March 12, 2024. FID only timed the first interaction. INP looks at responsiveness across the whole visit, so it is a stricter test, and its good threshold is 200 milliseconds.
Do Core Web Vitals affect Google rankings?
Yes, as one signal among many. Google's systems look for a good page experience, but relevant, useful content matters more than speed alone. Fix Core Web Vitals mainly because slow pages lose visitors; any ranking benefit is a bonus.
Why does PageSpeed Insights disagree with Search Console?
They measure different things. PageSpeed Insights shows field data for the URL you test plus a one-off lab test from Lighthouse. Search Console shows field data only, grouped across many URLs over a rolling 28 days. When they disagree, trust the field data and use the lab test to find causes.
Where to go next
If your server is the bottleneck, start with our hosting service. If you want pages built to the three thresholds from the first layout, see our web design work. For how speed fits with ranking and AI answers, read about SEO. Or contact us and we will measure your site and hand you a ranked fix list.
Related articles